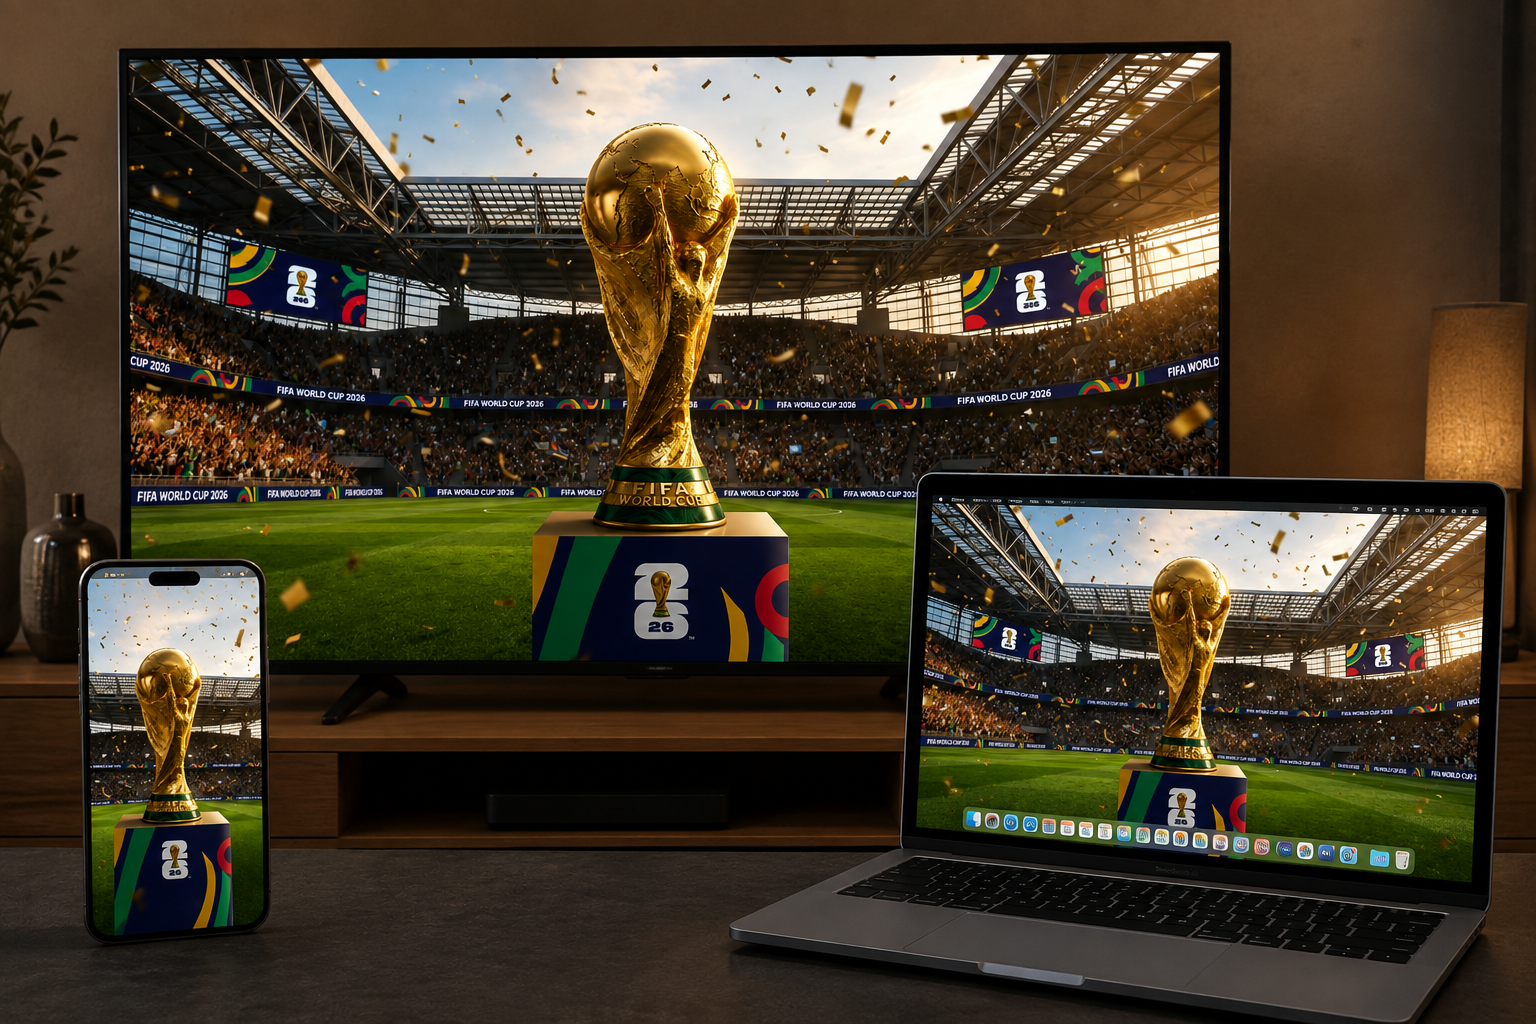
Mediastream has been operating since 2007. In nineteen years, this was the highest-concurrency event we have ever handled: nine broadcasters, nine countries, 74 matches and a peak of 4.7 million people watching at the same time. Here is what happened inside the operation.
A World Cup cannot be rehearsed. You can simulate traffic, but you cannot simulate the moment millions of people around the world stop what they are doing and tune in at the exact same second.
That is the difference between a large event and a mass event. In the first, demand rises. In the second there is no curve, there is a step. And anything that is badly sized breaks in the first ninety seconds, in front of everyone.
During the 2026 World Cup we operated that step 74 times. Here is what we learned.
The finding that forced us to revisit our own assumptions has nothing to do with infrastructure. It has to do with where people were watching:
With 105 minutes of World Cup per device and an average delivered bitrate of 2.7 Mbps.
Connected TV was the leading device. TV apps have stopped being the secondary channel that rounds out distribution: for high-value live content, they are the primary channel. That changes where investment pays off. Startup time on CTV, player behaviour on a 55-inch screen and ad format in the living room now matter more than further polishing the mobile player.
But the second data point is just as important and points the other way: almost a third of consumption happened on phones. The 2.7 Mbps average confirms it. That is not a fibre-in-the-living-room figure, it is the real average of a mixed region.
For a Latin American media company that means the encoding ladder cannot be copied from a northern case study. Optimising the high profiles while neglecting the low ones leaves a third of the audience without a decent experience. The real bitrate distribution of the market should define the ladder, not the aspiration.
At session start: geo, token, DRM and VPN detection. During the broadcast: bitrate, ads and telemetry, continuously.
Sports rights are the most expensive asset in the industry and also the easiest to leak. Every match was delivered with the territorial restrictions the contract required, without adding a single step for the legitimate viewer.
None of these components is exotic on its own. The hard part is getting all five planes to scale at the same rate. The whole system behaves like its slowest layer.
Which is where the phrase we ended up working with internally comes from: bandwidth is bought, compute is designed.
Demand does not depend on the fixture list, it depends on who wins. A major national team advancing multiplies the traffic of an entire market in a single round, and no plan drawn up in May anticipates that.
We learned that the hard way at the opening ceremony. The managed database service we were using did not auto-scale as it should have, and when it finally did scale, the operation affected the cluster. The impact lasted around 70 minutes and was felt at session start. It was behaviour we had not seen before in years of operation.
The fix did not come from the vendor, it came from us: stop depending on scaling happening by itself. We moved to scaling by calendar, provisioning with headroom ahead of every match and absorbing the cost of idle capacity for hours. It is more expensive. It is the right call when the event does not come around again. It was the only incident of the tournament: the remaining 73 matches ran without anything comparable.
Hydration breaks, introduced for the first time at this World Cup, created the commercial pod football never had. Two additional breaks per match, in play, without touching the pre-roll or halftime.
In our operation:
Every hydration break was additional inventory and DAI captured all of it. The infrastructure delivered the ad to the audience that was there, at the moment it was there.
That is the point we most want to leave on the table: the inventory of a mass event appears and disappears in three-minute windows. It is not sold with the logic of traditional ad buying, nor delivered with a manual integration. Either the system inserts live and at scale, or the inventory existed and nobody billed it.
57.9M devices. 41% on TV. 105 minutes per device.
With strong content, people come to your platform. And the technology is ready.
Every one of those devices arrived through a brand, generated first-party audience data and saw advertising sold by the media company that held the rights. That relationship is built during the event or it is handed over. It is not recovered afterwards.
Your brand. Your audience. Your advertising.
Whose audience will yours be at the next World Cup?
Mediastream did none of this alone. Behind each of those 74 matches were nine teams at nine media companies who decided to run the most important event of their last four years on our platform. Thank you for that trust. It is not a decision anyone makes lightly, and we do not take it for granted.
The 2026 World Cup produced more public streaming data than any previous tournament, and almost none of it is comparable to the rest. Here are the external reference points most useful for placing the figures above, with their sources.
Concurrency. YouTube reported a peak above 27 million simultaneous viewers for the final, across its official broadcasts in more than 40 markets. In Brazil, the free channel CazéTV reached 17.8 million concurrent viewers in a single match, according to Streams Charts. The BBC reached 1.43 million concurrent viewers in the UK during the knockout rounds, according to AWS.
Delivery. Amazon CloudFront reported more than 117 Tbps at the moment of Spain's goal, across more than 40 broadcasters on six continents, its largest peak on record, against 23 Tbps at Qatar 2022. DE-CIX registered 28.4 Tbps in aggregate during Portugal against Spain.
Devices. According to Cloudflare's measurement during the final, connected TV accounted for 65% of traffic in the United States, 61% in London and 55% in Germany. Our regional 41% says something specific: Latin America reached the big screen, but remains a substantially more mobile market than the United States or Europe.
Advertising. In the United States, Guideline estimates USD 1.19 billion in combined ad sales for Fox and Telemundo/Peacock, up 170% on Qatar. Of that total, traditional television took USD 1.03 billion: 86%. After the most streamed World Cup in history, streaming captured roughly 14% of the American advertising pot. The gap is not in the infrastructure, it is in measurement and in sales.
One caution covering all of the above. None of these figures uses the same definition. As Carlo De Marchis, documented, almost no rights holder published the same metric twice, and several replaced the uncomfortable number with an activity metric instead. Dan Rayburn has been pointing out for years that without a common definition none of these figures is comparable to any other. They cannot be divided into one another, and we are not doing that either.
All figures come from Mediastream's own platform analytics and are not audited by an independent third party, the same limitation that applies to the infrastructure vendor figures published this summer, including every one cited in the appendix.
If you are planning coverage of a high-demand live event, let's talk.
External sources: AWS · Cloudflare · YouTube · Streams Charts · Sportico / Guideline · Carlo De Marchis


.png)
.jpeg)